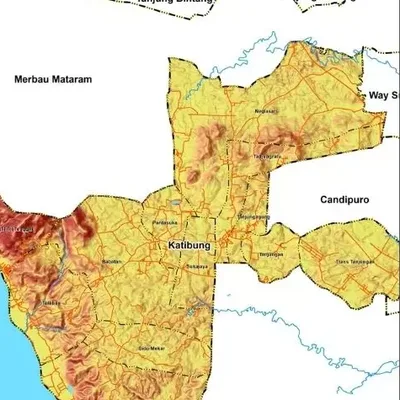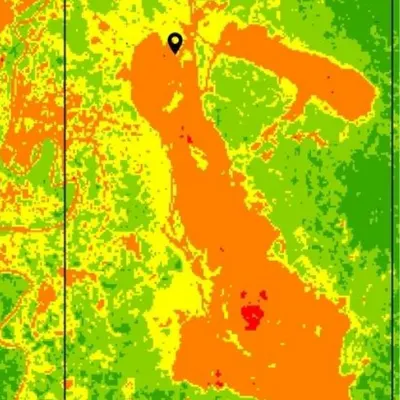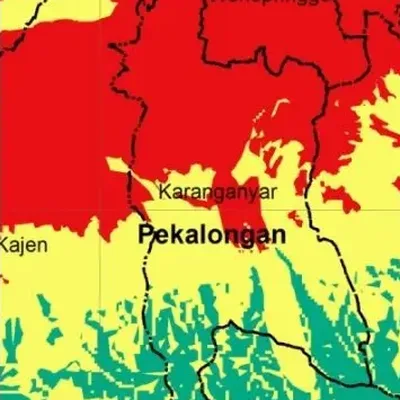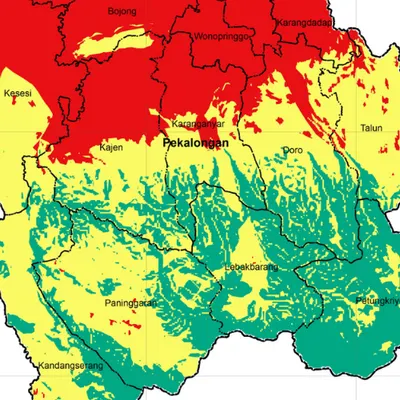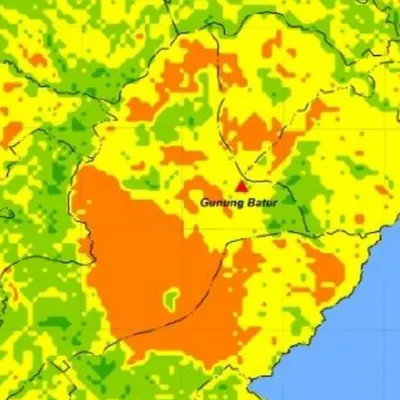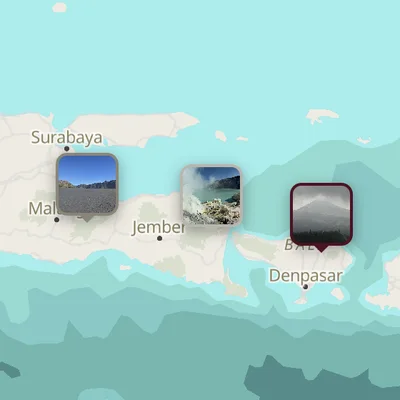
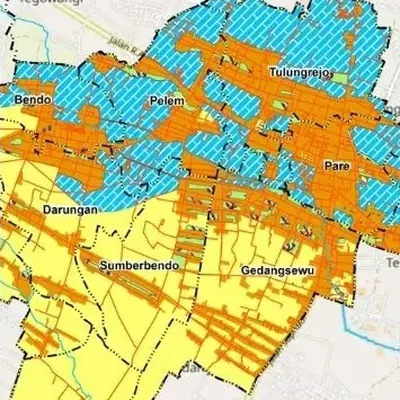
What the map shows
- Land use in each year compared
- Where land changed and how, for example rice field to housing
- A table of changed areas (transition matrix)
Data we use
- Landsat or Sentinel-2 imagery from the chosen years
- Official land use data (for example KLHK) where available
- Your field data for checking
Often used for
- Theses on land conversion and urban sprawl
- Environmental and carrying capacity studies
- Reviewing spatial plans
Price
Price per map, by the size of the area and how fast you need it.
| Area | 7–5 days | 4–3 days | 2–1 days |
|---|---|---|---|
| Village | $17 | $21 | $28 |
| District | $19 | $23 | $31 |
| Regency | $22 | $26 | $34 |
| Province | $30 | $36 | $48 |
| Country | $56 | $67 | $90 |
| World | $122 | $147 | $196 |
Common questions
How much does a land use change map cost?
From $17 for a village-sized area in 7–5 days. The price goes up for larger areas and faster delivery, up to $196 for world scale in 2–1 days. See the table above.
How long does it take?
You choose: 7–5 days, 4–3 days or 2–1 days. Faster delivery costs more.
How many years can be compared?
At least two. Three or more works too, for example 2014, 2019 and 2024. Ask us for a price for more than two years.